Gauteng City-Region Viewer - Help
-
Viewer Menus
-
Explore the Viewer
-
Additional information
Viewer Menus
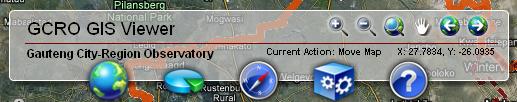
There are 5 clickable icons (buttons) on the GCRO Viewer toolbar. They are Base Maps, GCRO Dynamic Data, Navigation, Tools and Help. Clicking one of these buttons or hovering over it will open a menu under the button. This menu will collapse if the mouse pointer is no longer hovered over the icon or over the menu. On selection of an menu item, an adequate action will be taken which depends on the menu item in question. In many case the clicking of the menu item will open a widget (window) on right side of the Viewer. As the cursor moves away from the widget it will turn transparent to enable complete visibility of the map. The widgets can be collapsed by clicking on the Minimize Button (green arrow) found on the right-hand side of widget's title bar.
Go to Top-
Base Maps
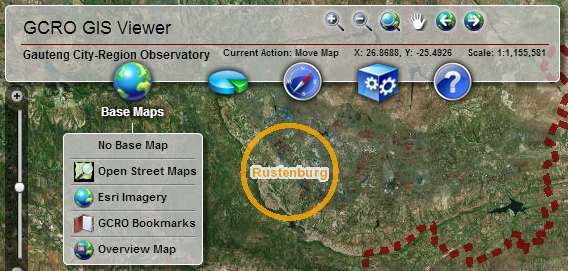
Clicking the Base Maps icon, which is the first (i.e. leftmost) button on the toolbar, displays a menu with the following items: No Base Map, Open Street Maps, Esri Imagery, GCRO Bookmarks and Overview Map.
The first three menu items are options for the choice of the base map. The base map provides a passive background that mainly serves for orientation. The operational map layers are superimposed on the base map. The user can choose to do without a base map or he can choose either a drawn map (Open Street Maps) or imagery (Esri Imagery).
The remaining two options have in fact nothing to do with the base map. They have been added here faute de mieux. Clicking the GCRO Bookmarks menu item will open a widget (window) that offers predefined locations that a user can select to zoom to particular areas that have a special interest, e.g. the GCRO Offices. Finally, clicking the Overview Map menu item opens an inset window that shows the location of the current Viewer within a broader context, e.g. the Gauteng region as it is located within South Africa.
Go to Top -
GCRO Bookmarks
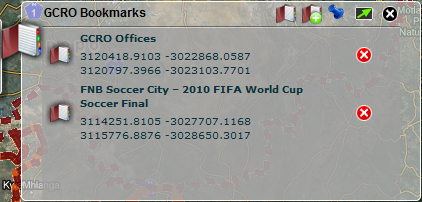
The Bookmarks tool allows the user to zoom to predefined locations. Alternatively, the user may also add his/her own locations to this tool. To zoom to a bookmark the user must simply click on the bookmark in the table. Bookmarks may be added to or deleted from the list by clicking the
 icon next to a bookmark's name. The list below gives a brief overview of the use of the Bookmarks
tool.
icon next to a bookmark's name. The list below gives a brief overview of the use of the Bookmarks
tool.
- Bookmarks
 Clicking on this icon will bring up the list of current bookmarks.
- Add Bookmarks
 Clicking on this icon allows the user to add new bookmarks. When this icon is clicked a new panel
opens where the user types in the new bookmark's name. Once the bookmark has been added it gets
added to the bookmark list.
Clicking on this icon allows the user to add new bookmarks. When this icon is clicked a new panel
opens where the user types in the new bookmark's name. Once the bookmark has been added it gets
added to the bookmark list.
- Docked
 Clicking on this icon will dock the tool on the right-hand side of the Viewer. A tool is undocked if
it is manually moved around the Viewer.
Clicking on this icon will dock the tool on the right-hand side of the Viewer. A tool is undocked if
it is manually moved around the Viewer.
- Lock Widget Transparency
 This icon sets the tool's transparency to 0%, i.e. when this icon is clicked the tool will
not be transparent anymore and the map won't be seen through the tool.
This icon sets the tool's transparency to 0%, i.e. when this icon is clicked the tool will
not be transparent anymore and the map won't be seen through the tool.
- Minimise
 Clicking this icon will minimise the tool, i.e. collapse the tool.
- Close
Go to Top The tool can be closed by clicking on this icon.
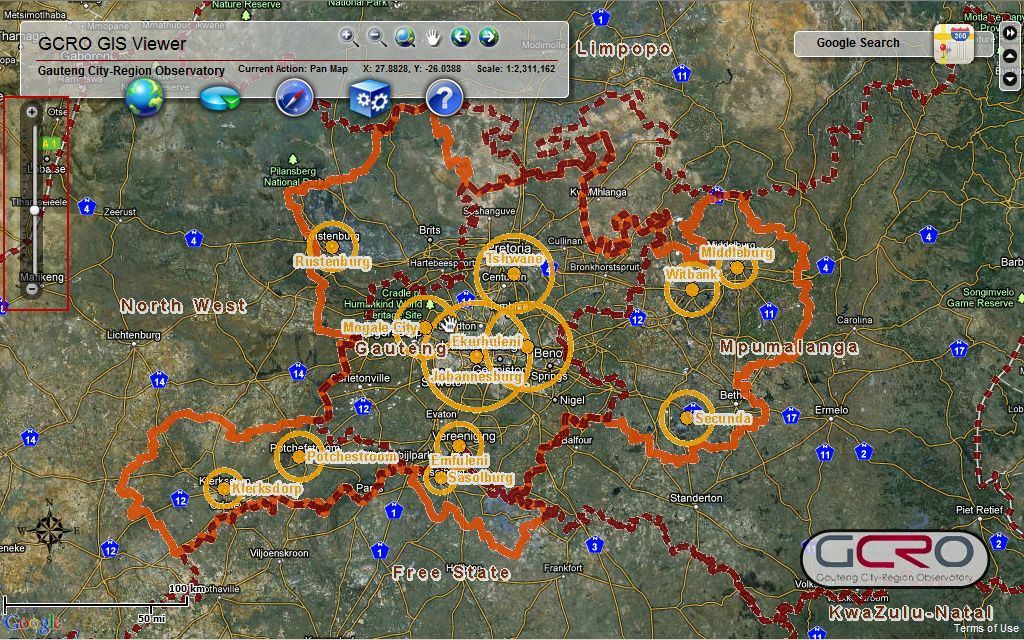
Overview Map
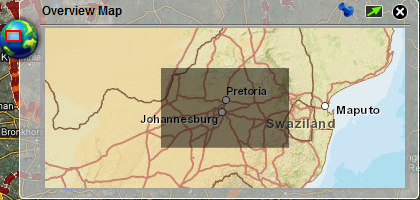
The Overview window displays a generalised, smaller-scale map with the full extent of the map seen in the viewer along with its surrounding area. Clicking on the Overview map icon allows the user to open the overview map. The current view will be indicated by a red rectangle within the overview window. Clicking on the tool will open a separate window on the top right hand side of the viewer. The list below gives a brief overview of the use of this tool.
- Docked
Clicking on this icon will dock the tool on the top right-hand side of the Viewer. A tool is
undocked if it is manually moved around the Viewer.
- Lock Widget Transparency
This icon sets the tool's transparency to 0%, i.e. when this icon is clicked the tool will
not be transparent anymore and the map won't be seen through the tool.
- Minimise
Clicking this icon will minimise the tool, i.e. collapse the tool.
- Close
Go to Top
The tool can be closed by clicking on this icon.
GCRO Dynamic Data
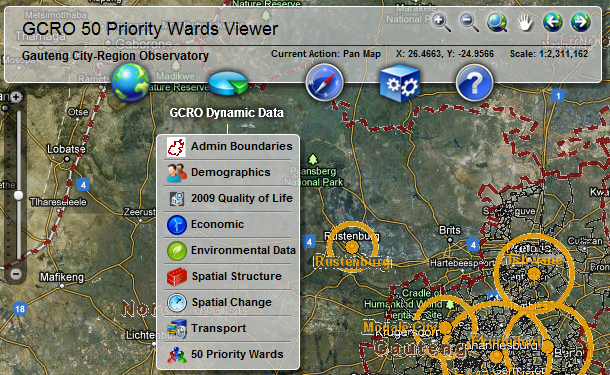
This menu consists of a number of themes. Nine themes are currently available for the GCRO Dynamic Data. These include Admin Boundaries (Administrative Boundaries), Demographics, 2009 Quality of Life, Economic, Environmental Data, Spatial Structure, Spatial Change, Transport and 50 priority wards (which is a specialised theme that opens in a new viewer). Each theme consists of available live maps, graphs and metadata. For more information on these themes see Admin Boundaries , GCRO Themes or 50 priority wards .
Go to TopNavigation
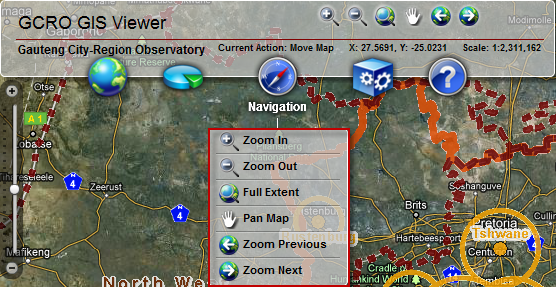
Basic tools have been included to allow users to zoom in or out of the map, to view the full extent of the map, as well as pan the map within the viewer. For example, to zoom in: click on the zoom in tool and then hold down the left click and draw a box around the area to zoom into. Additional zoom capabilities such as zoom previous and zoom next have been included, which are activated by just clicking on the tool. The list below gives a brief overview of the various navigational tools.
Zoom In
 This tool allows the user to zoom into an area of interest. Click and while holding the
mouse button in drag a rectangle over the area you wish to zoom to. Once the mouse button is
released the map will zoom in to the area of the rectangle.
This tool allows the user to zoom into an area of interest. Click and while holding the
mouse button in drag a rectangle over the area you wish to zoom to. Once the mouse button is
released the map will zoom in to the area of the rectangle.
Zoom Out
 This tool allows the user to zoom out of an area of interest. Click and while holding the
mouse button in drag a rectangle over the area you wish to zoom to. Once the mouse button is
released the map will zoom out of the area of the rectangle.
This tool allows the user to zoom out of an area of interest. Click and while holding the
mouse button in drag a rectangle over the area you wish to zoom to. Once the mouse button is
released the map will zoom out of the area of the rectangle.
Full Extent
 Clicking this tool will zoom the extent of the Viewer to that of when the Viewer first opened.
Pan Map
 This tool allows the user to pan over the map area. Click then hold the left mouse button on
the map and drag the map. The map will be re-centred with the location dragged at the
location you dropped it.
This tool allows the user to pan over the map area. Click then hold the left mouse button on
the map and drag the map. The map will be re-centred with the location dragged at the
location you dropped it.
Zoom Previous
 This tool allows the user to step the map back to the previous extent.
Zoom Next
 This tool allows the user to step the map back to the next extent.
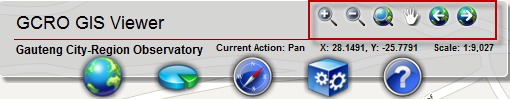
NOTE: All these tools are also available as icons on the GCRO Viewer toolbar.
Tools
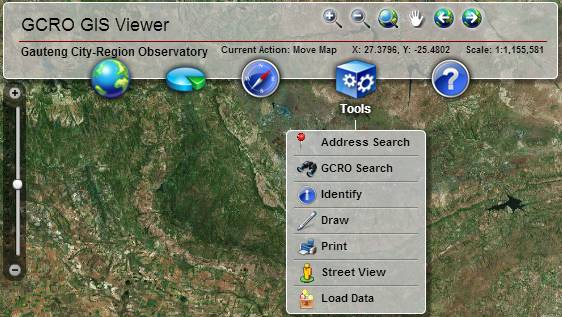
This menu contains a number of tools that improve the functionality of the Viewer. These tools are two search functions (Address Search and GCRO Search), Identify, Draw, Print and Street View tools as well as a tool that allows the user to add data to the viewer (Load Data). The Address Search allows users to search for a street address typed in by the user. The GCRO Search tool allows users to search the GCRO Administrative Layers which could be a graphical search or a text search. The Identify tool enables a specific location on the map to be identified and detailed information about that location is returned. The drawing tool allows users to draw and perform measurements on the map in the viewer. The Print functionality offers printing the Viewer map to PDF. The Street View tool opens Google's street view for a point placed by the user in the viewer and the Load Data tool allows the user to add data in a variety of formats to the viewer.
Go to TopHelp
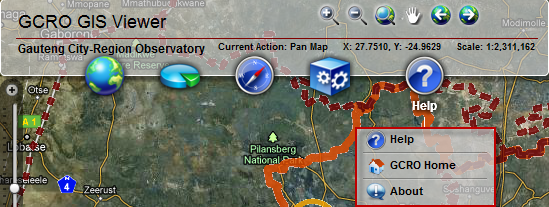
The Help tool will open the help manual. This manual explains the use of the viewer in detail. The GCRO Home tool is a link to the GCRO home page Selecting this option will open the GCRO home page in another window. The About option refers to the details of the Sample Flex Viewer powered by Esri Inc.
Go to TopAdditional Functionality
There are a number of additional tools that do not form part of a specific menu provided in the viewer.Zooming
Additional navigational functionality is also provided by the zoom toolbar. This toolbar is always visible on the left-hand side of the Viewer. The user may zoom into an area or zoom out of an area by clicking in the up arrow or down arrow respectively.
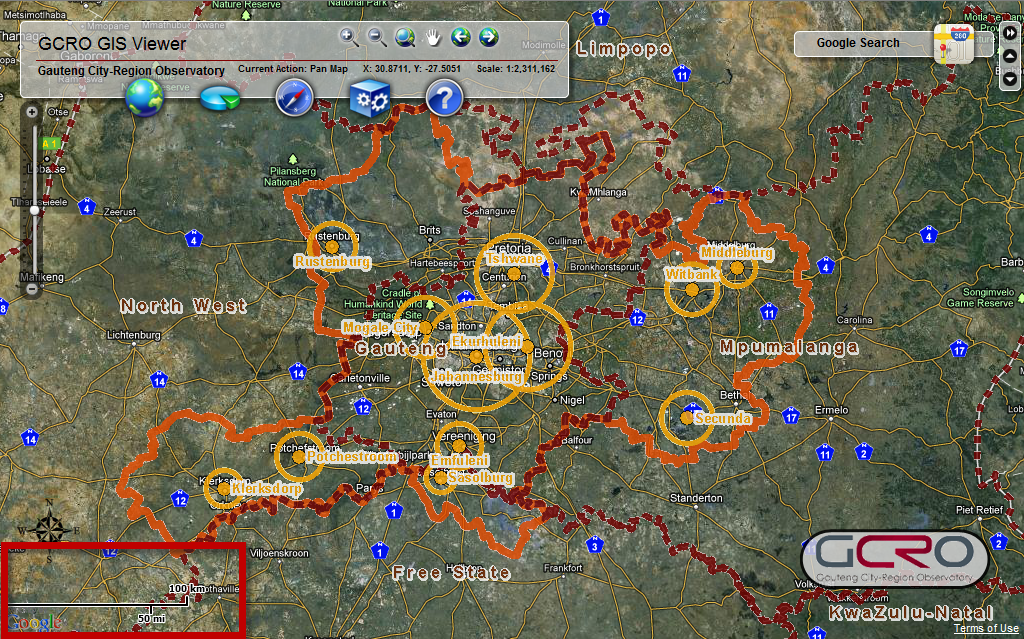
Scale Bar
The scale bar is located at the bottom left of the Viewer and changes as the user zooms in or out of the extent, i.e. the scale bar is dynamic.
GCRO Homepage
The logo of the Gauteng City-Region Observatory is located at the bottom right of the Viewer. Clicking on this logo will open the GCRO homepage in another window.
Go to Top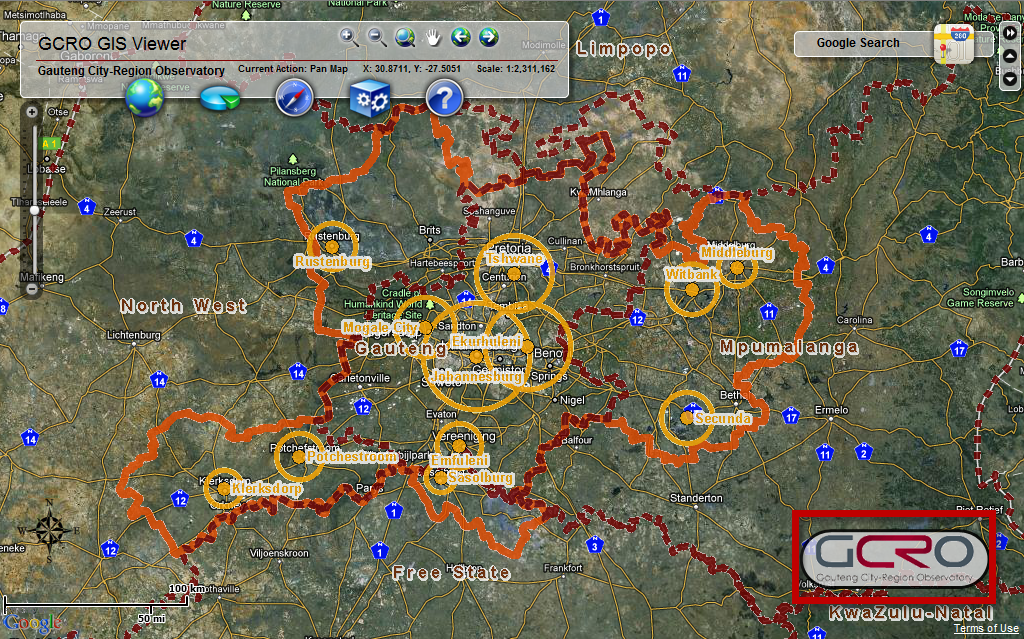
Explore the Viewer
Admin Boundaries

This tool contains various boundary data for the region. A map layer from this table of contents can be switched on by clicking on the check box next to the layer. To switch off the map the layer, the check box must be unticked. To remove all the Admin Boundaries, the check box next to the title 'Admin Boundaries' must be unchecked. Admin Boundaries consist of:
- Live Maps;
- Layer Transparency for each theme;
- Metadata;
- Map Legend;
- Docked;
- Minimise; and
- Close.
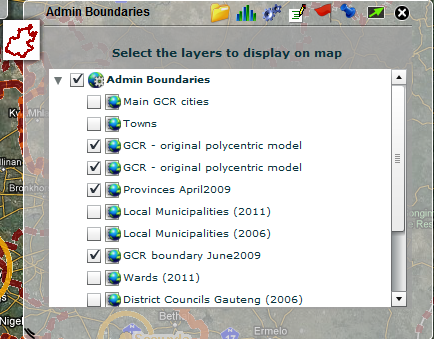
- Admin Boundaries (Live Maps)
 Clicking this icon will bring the tool back to the list of layers in the table of content.
Ensure the main layer title (Admin Boundaries) is ticked to ensure the theme layers are
displayed. An individual map layer can be switched on and off by clicking the corresponding
check box. Some layers may have been grouped and the group can be expanded to view the
individual layers by clicking on the expand button (triangle) to the left of the map layer name.
Clicking this icon will bring the tool back to the list of layers in the table of content.
Ensure the main layer title (Admin Boundaries) is ticked to ensure the theme layers are
displayed. An individual map layer can be switched on and off by clicking the corresponding
check box. Some layers may have been grouped and the group can be expanded to view the
individual layers by clicking on the expand button (triangle) to the left of the map layer name.
NOTE: Some layers only display when zoomed in or out to a certain scale, indicated by a "greyed out" tick box next to the layer name.
- Chart Statistics
 Clicking this icon allows the user to create charts pertaining to the currently selected theme.
Data may be dynamically linked to the map, i.e. the chart will change as the user
changes values in the Viewer.
Clicking this icon allows the user to create charts pertaining to the currently selected theme.
Data may be dynamically linked to the map, i.e. the chart will change as the user
changes values in the Viewer.
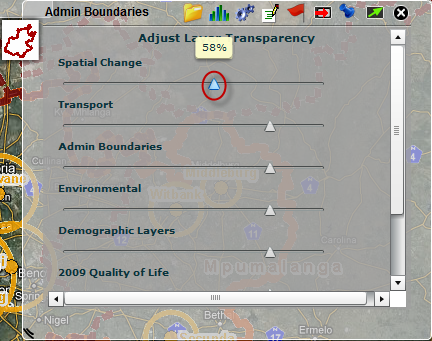
NOTE: This particular theme has no chartable data. - Layer Transparency
 This icon will bring up a panel where the user may change the transparency of the various themes.
Changing transparency will only have an effect if the theme is visible, i.e. the check box
next to the theme's name is checked. Transparency is adjusted by moving the arrow along the
transparency toolbar, moving the arrow all the way to the right assigns a transparency of 100% to
the theme; moving the arrow all the way to the left assigns a transparency value of 0%.
This icon will bring up a panel where the user may change the transparency of the various themes.
Changing transparency will only have an effect if the theme is visible, i.e. the check box
next to the theme's name is checked. Transparency is adjusted by moving the arrow along the
transparency toolbar, moving the arrow all the way to the right assigns a transparency of 100% to
the theme; moving the arrow all the way to the left assigns a transparency value of 0%.
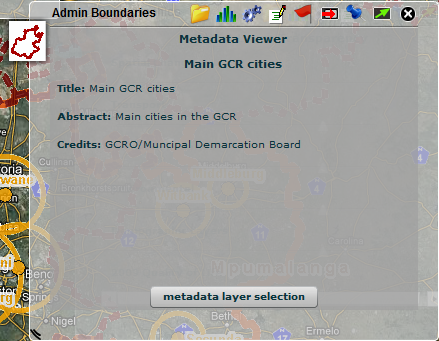
- Metadata
 This icon will open a panel where the user may view the metadata of the various layers. All
available data will have their metadata displayed here, independent of whether or not the layer
is currently visible.
This icon will open a panel where the user may view the metadata of the various layers. All
available data will have their metadata displayed here, independent of whether or not the layer
is currently visible.
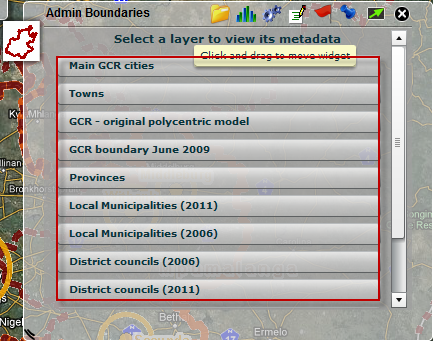
Clicking on any of the metadata buttons will open a new window containing the metadata of that particular layer. The user may also navigate back to the list of metadata by clicking the
 button.
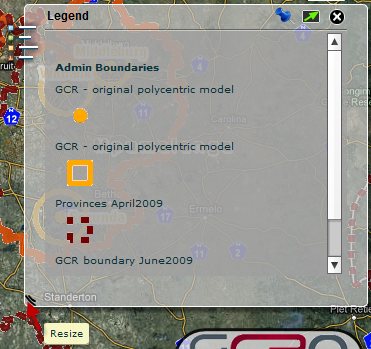
- Map Legend
 This icon will bring up the symbolisation of the visible layers. The legend will open in a new
window. This window may also be resized by dragging the bottom left corner.
This icon will bring up the symbolisation of the visible layers. The legend will open in a new
window. This window may also be resized by dragging the bottom left corner.
- Docked
Clicking on this icon will dock the tool on the right-hand side of the Viewer. A tool is
undocked if it is manually moved around the Viewer.
- Lock Widget Transparency
This icon sets the tool's transparency to 0%, i.e. when this icon is clicked the tool
will not be transparent anymore and the map won't be seen through the tool.
- Minimise
Clicking this icon will minimise the tool, i.e. collapse the tool.
- Close
Go to Top
The tool may be closed by clicking on this icon.
GCRO Themes
Each theme in this menu provides different information to the user. Each item in the drop-down menu will open a tool with a number of additional functionality pertaining to that particular tool. This functionality and how it may be accessed is common to all the different themes.
Each theme is composed of:
- The Live Maps available for the corresponding theme;
- The Layer Transparency for each theme;
- Metadata;
- Map Legend;
- Docked;
- Minimise ; and
- Close.
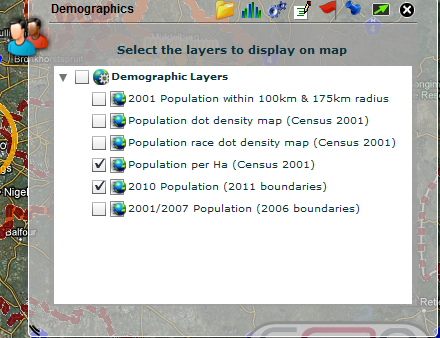
All themes work in a similar fashion and as such only a selected theme will be explained here ( 50 priority wards is a unique case which is detailed later in the help). The Live Maps for the selected theme of 'Demographics' is shown below. Ensure the main layer title (Demographics) is ticked to ensure the theme layers are displayed. An individual map layer can be switched on and off by clicking the corresponding check box. Some layers may have been grouped and the group can be expanded to view the individual layers by clicking on the expand button (triangle) to the left of the map layer name.
NOTE: Some layers only display when zoomed in or out to a certain scale, indicated by a "greyed out" tick box next to the layer name.
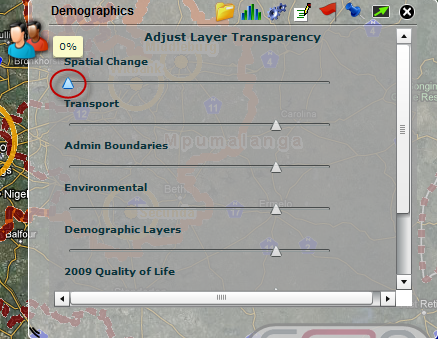
The available Layer Transparency for selected themes is shown below. The scale of transparency for each theme can be adjusted by moving the transparency scale bar for the corresponding layer.This icon will bring up a panel where the user may change the transparency of the various themes. Changing transparency will only have an effect if the theme is visible, i.e. the check box next to the theme's name is checked. Transparency is adjusted by moving the arrow along the transparency toolbar, moving the arrow all the way to the right assigns a transparency of 100% to the theme; moving the arrow all the way to the left assigns a transparency value of 0%.
The Chart Statistics provides a list of layers from which a dynamic graph may be created and displayed. An option has been provided to only show the graph or show the graph dynamically linked to the map.
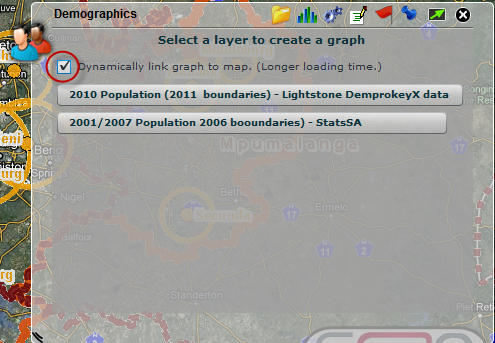
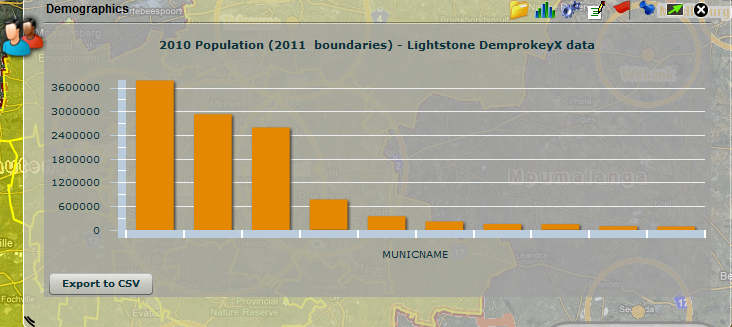
Once a graph is selected from the list, the graph for the selected layer is then displayed and the name of the selected layer is shown above the graph.
If only the graph option was selected (i.e. dynamically link graph to map is not selected), only a graph will be displayed. When moving the mouse over the data on the graph, the actual statistics and details of each region will be shown as a label.
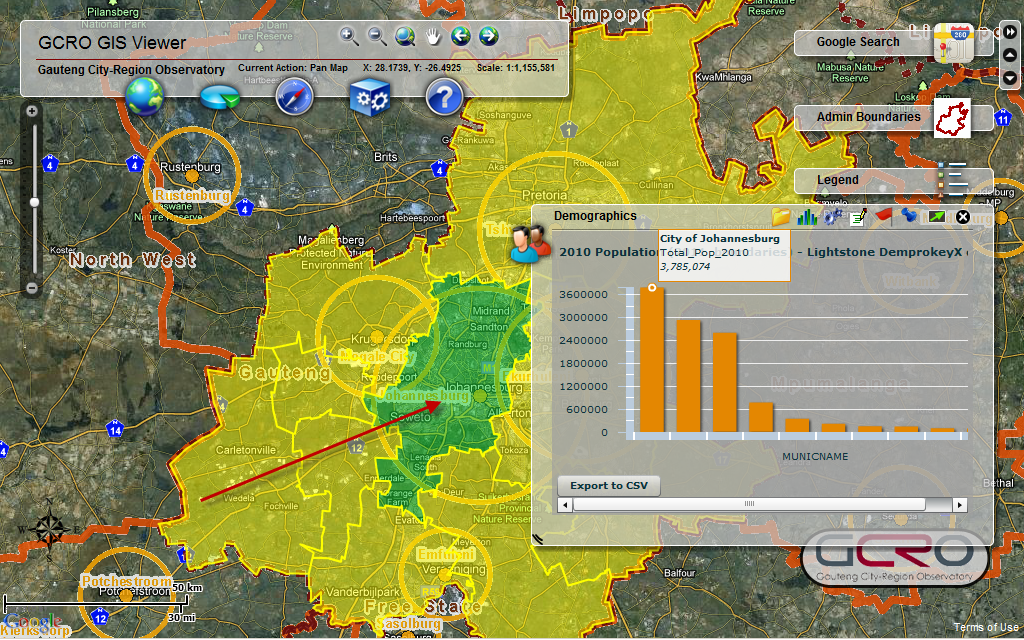
If the graph dynamically linked to map option is selected, the region from where the data is extracted for the graph will be outlined and coloured on the map. It may take a while to load the highlighted map. When the user hovers over data on the graph the actual statistics and details of each region will be shown as a label and in addition the corresponding region on the map will be highlighted. When one of the graph feature is clicked, the map will zoom to the selected feature.
To remove the highlight dynamically linked map, close the theme widget, or select chart statistics again.
The user may also export the carted data to a CSV file. To do this he/she must simply click on the
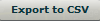 button. This will bring up a
dialog box for saving the data. This is dependent on the user's operating system and local machine
specifications.
button. This will bring up a
dialog box for saving the data. This is dependent on the user's operating system and local machine
specifications.
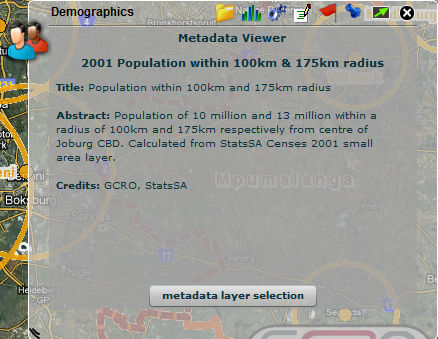
The metadata provides a list of layers from which metadata can be displayed. This icon will open a panel where the user may view the metadata of the various layers. All available data will have their metadata displayed here, independent of whether or not the layer is currently visible.
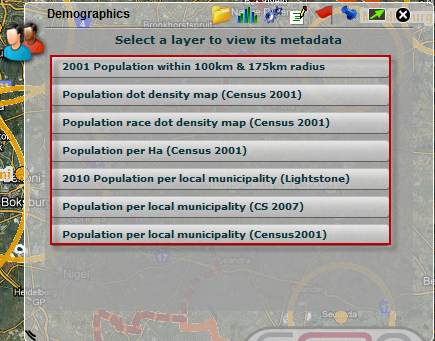
Clicking on any of the metadata buttons will open a new window containing the metadata of that particular layer. The user may also navigate back to the list of metadata by clicking the
button.
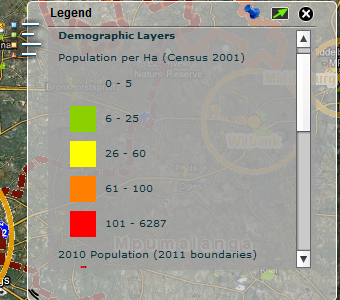
A Map Legend for the selected theme is available be selecting the flag icon. This icon will bring up the symbolisation of the visible layers. The legend will open in a new window. This window may also be resized by dragging the bottom left corner.
- Docked
Clicking on this icon will dock the tool on the right-hand side of the Viewer. A tool is undocked if
it is manually moved around the Viewer.
- Lock Widget Transparency
This icon sets the tool's transparency to 0%, i.e. when this icon is clicked the tool will
not be transparent anymore and the map won't be seen through the tool.
- Minimise
Clicking this icon will minimise the tool, i.e. collapse the tool.
- Close
Go to Top
The tool may be closed by clicking on this icon.
Address Search
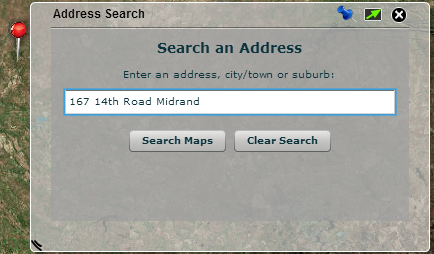
The Address Search allows the users to search for an address or a point of interst such as a business or shop. When clicking
 the tool will be populated with possible results. Clicking on any of the results as they appear in
the tool will zoom the user to the location of the result. The result will be indicated by a red
pin, as can be seen below.
the tool will be populated with possible results. Clicking on any of the results as they appear in
the tool will zoom the user to the location of the result. The result will be indicated by a red
pin, as can be seen below.
Go to Top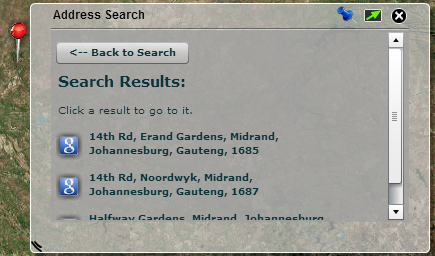
-
GCRO Search
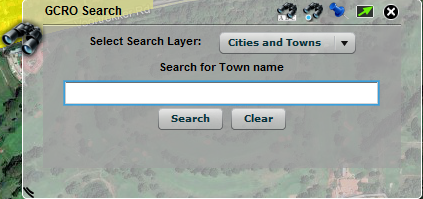 The GCRO search extends across the GCRO layers and the following fields maybe searched within:
Cities and Towns, Municipalities, Wards 2011.
Two types of searches are available:
The GCRO search extends across the GCRO layers and the following fields maybe searched within:
Cities and Towns, Municipalities, Wards 2011.
Two types of searches are available:
- Text Search

- Graphical Search

-
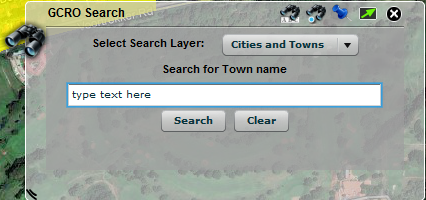
Text Search: Select one of the fields mentioned above from the drop down list to search within. Thereafter enter a name in the textbox and select the search button. To perform a new search, select the Clear button and repeat the above process.
-
Graphical Search: Select a field from the drop down list to search within. Thereafter select a drawing tool from the options provided. Use this tool to select a region on the map to search in.
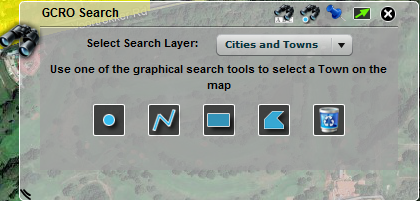
Available graphical selection tools are:
- Select by Point;

- Select by Line;

- Select by Rectangle; and

- Select by Polygon.

You may also clear all selected features by clicking the
Go to Top icon.
icon.
-
-
Identify Widget
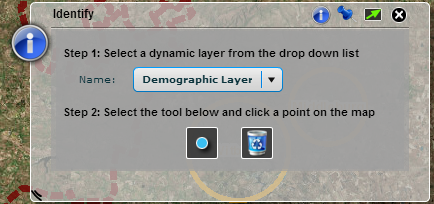
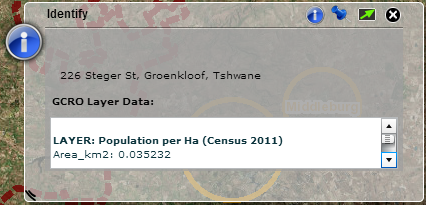
The Identify widget allows users to obtain information about a point location on the map. First open the Identify widget by clicking the Identify menu item on the Tools menu. When the widget appears, select the layer in the drop-down in the middle of the widget (e.g. Demographic Layer). Now you need to identify the location on the map. Activate the Identify map tool by clicking on the dot icon under the layers drop-down. Then click on the area on the map in which you are interested. After a short while, the Identify widget should show the results. On top it should show the street address of the clicked location. The data returned by the chosen layer are shown below the address inside the scrollable frame in the middle of the widget. Scroll down to find the GCRO data in which you are interested (e.g. the population density).
To start another identify task, click on the
Go to Top . This
will return the user to the first page of the tool. Then select
to clear the results of the previous identification task and perform the above process again.
. This
will return the user to the first page of the tool. Then select
to clear the results of the previous identification task and perform the above process again.
-
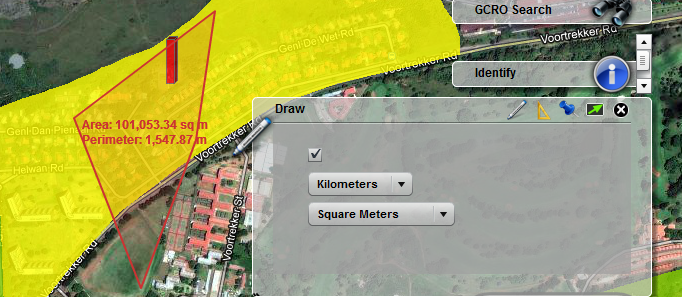
Draw Widget
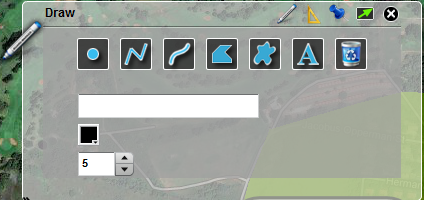
The Draw tool enables different types of shapes to be drawn on the map. The tool also offers for measurements to be performed on the map. Depending on your network connection, this tool may react slowly and should be used with a degree of patience.
How to use the tool:
-
Select the draw icon on the draw widget and choose one of the drawing tools,
i.e. shapes.
After the tool is selected click on the map to start drawing. The dimensions and appearance of
the drawing can be modified by changing the colour and size of the tool. Each tool is used
differently. To return to the default panel of the tool click the
 at the top right
side of the tool.
at the top right
side of the tool.
-
Point:
Click a position on the screen to draw a point. -
Line:
Select a position on the map to start drawing the line. To change the direction in which the line is drawn, click another point on the map to stop and thereafter change the direction. To complete the drawing the line, double click on the final point on the map. -
Freehand Line:

Click a position on the map to start drawing. Keep the left mouse button down to continue drawing the line freehand. Release the mouse button to stop drawing. -
Polygon and Freehand Polygon:

To start drawing click a position on the map. To continue drawing the polygon keep the left mouse button down. When the polygon is complete release the mouse button. -
Text:

Enter text in the Text field. Select the font name, colour and appearance of the text. Thereafter click a position on the map to place the text. -
Recycle Bin:
Removes all previously drawn images. -
Measurements can be performed by selecting the
 icon in the toolbar of the widget. Check the checkbox, before you start drawing for measurements
to be shown on the map. Select the units of measurement and the graphical appearance of the
measurements. Then go back to the drawing tool icon and select the shape to be drawn/measured
and draw the shape on the map - the measurements will display after a few seconds.
icon in the toolbar of the widget. Check the checkbox, before you start drawing for measurements
to be shown on the map. Select the units of measurement and the graphical appearance of the
measurements. Then go back to the drawing tool icon and select the shape to be drawn/measured
and draw the shape on the map - the measurements will display after a few seconds.
-
Select the draw icon on the draw widget and choose one of the drawing tools,
i.e. shapes.
After the tool is selected click on the map to start drawing. The dimensions and appearance of
the drawing can be modified by changing the colour and size of the tool. Each tool is used
differently. To return to the default panel of the tool click the
-
50 priority wards
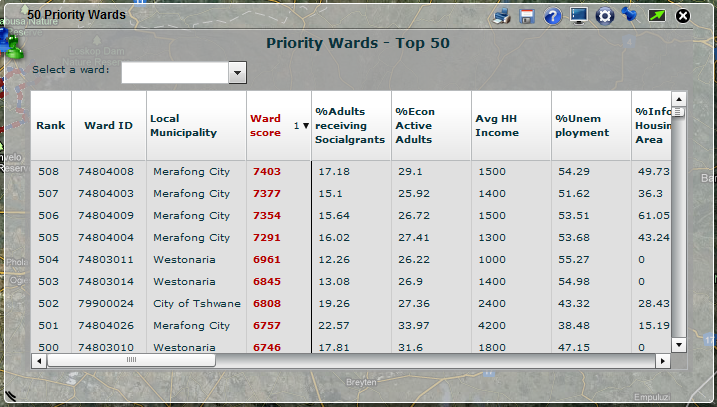
The 50 priority wards (50PW) viewer contains results of the 50 PW project in the form of tabular results and dynamic maps. The map opens with the 50 PWs (ward score field) highlighted in the table and mapped. Any of the individual indicators' headings (e.g. %Adults recieving Socialgrants) can be selected to activate the selected indicator and map display. Change the number of wards displayed or switch on worse than mean by clicking the display settings icon,
 .
To change the weights of each indicator or view detailed information about each indicator click on
the Change indicators and weights icon,
.
To change the weights of each indicator or view detailed information about each indicator click on
the Change indicators and weights icon,
 .
The 50 priority wards also has a unique print feature to print the map with a data grid of the
selected indicator records.
.
The 50 priority wards also has a unique print feature to print the map with a data grid of the
selected indicator records.
Or click on the step by step guide,
 for more info.
The Export to CSV button exports the current rank order of the wards to a CSV file. Press the
Go to Top button,
select the location for the CSV file and click save.
button,
select the location for the CSV file and click save.
-
Printing

Printing is done by downloading a PDF file to the local machine. First open the Print widget by clicking the Print menu item on the Tools menu. When the widget appears, select whether you want to print only the map or everything you see. The latter option includes for example widgets and buttons on top of the map but also the scalebar. Then click the
Go to Top button. A PDF file will be created and downloaded to the user's machine. The detail of how this is
done and communicated to the user depends on the user's browser, operating system and local machine
specifications.
button. A PDF file will be created and downloaded to the user's machine. The detail of how this is
done and communicated to the user depends on the user's browser, operating system and local machine
specifications.
-
Street View
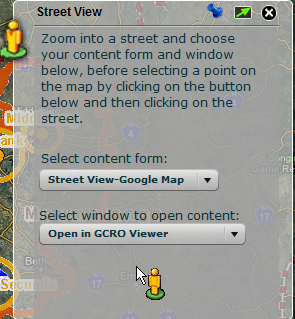
This tool allows the user to open Google Street View for a location they choose on the map.
NOTE: The tool will not open Street View if Street view is not available for the location the user chose. The tools requires three steps to be performed by the user:
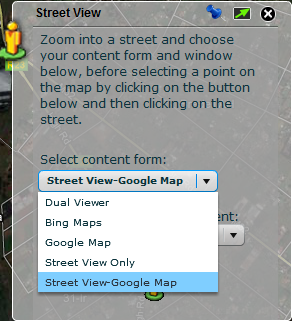
1) The user may choose to show the Street View by itself or together with other content such as e.g. Google Maps. Select the content to be displayed from Dual View, Bing Map, Google Maps, Street View Only or Street View-Google Map. These are all options provided in the first drop-down menu. Then zoom in to the area you wish to open Street View for.
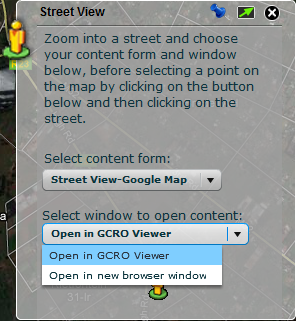
2) Choose to open the result inside the GCRO Viewer or alternatively in a new window, i.e. outside the GCRO Viewer.
3) Click on the
Go to Top icon
provided in the tool and then click on the map at the location for which you would like to open Street
View.
icon
provided in the tool and then click on the map at the location for which you would like to open Street
View.
-
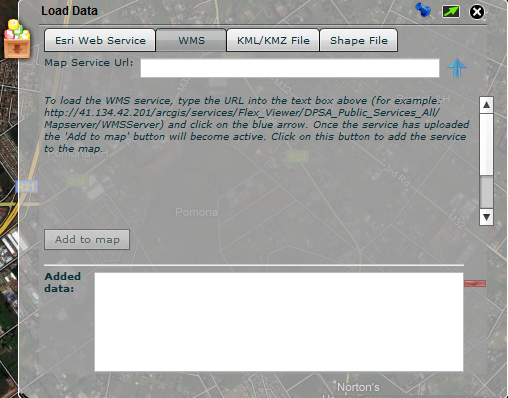
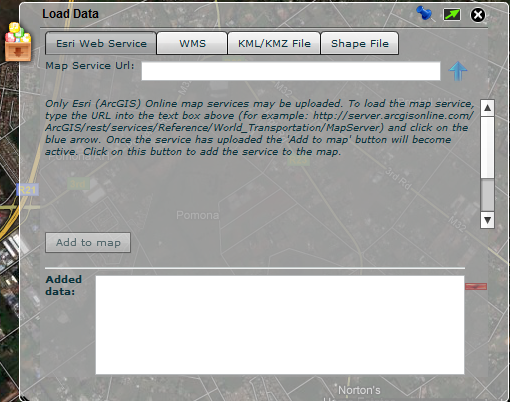
Load Data
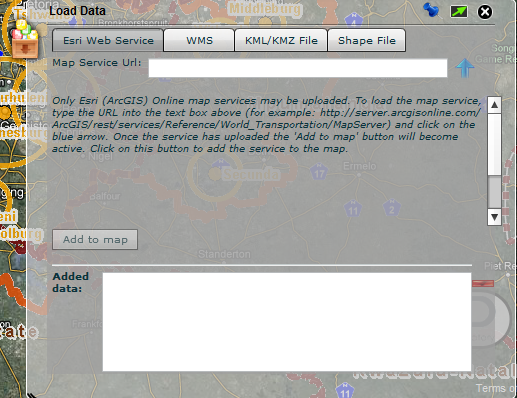
This tool allows the user to add data to the Viewer. The user can add Esri Online map services, WMS services, KML/KMZ files as well as shapefiles. When the tool first opens the user will see four panels to the tool. Each panel works the same in how data are uploaded, the only difference being in which format the data must be.
1) Adding Esri Online map services:
Type the URL to the map service into the text box provided. Then click the
 icon. Wait for the service to be uploaded. Once the
 has disappeared the
 button will be come active. Click on this button to add the service to the map.
2) Adding WMS:
Type the URL to the map service into the text box provided. Then click the
icon. Wait for the service to be uploaded. Once the
has disappeared the
button will be come active. Click on this button to add the service to the map.
3) Adding KML/KMZ files:
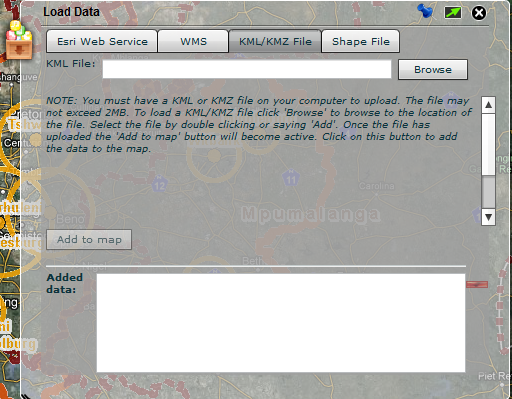
Click the
 icon to browse to the location on your computer of the file to be uploaded. Wait for the file to be
uploaded. Once the
has disappeared the
button will be come active. Click on this button to add the file to the map.
icon to browse to the location on your computer of the file to be uploaded. Wait for the file to be
uploaded. Once the
has disappeared the
button will be come active. Click on this button to add the file to the map.
4) Adding shapefiles:
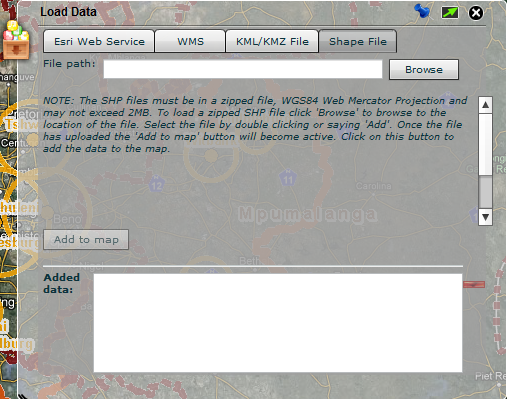
Click the
icon to browse to the location on your computer of the shapefile to be uploaded. Wait for the
shapefile to be uploaded. Once the
has disappeared the
button will be come active. Click on this button to add the shapefile to the map.
NOTE: You can only add one shapefile at a time. The shapefile must be in the WGS84 Web Mercator projection and it must be contained within a zipped folder. If any of these parameters are not valid you won't be able to upload the shapefile.
Go to Top
Additional Information
-
System requirements
Additional requirements
- A reasonable Internet connection
- JavaScript enabled web browser
- Adobe Flash Player 9 or higher
- Minimum screen resolution of 1024 x 768
Contacts and comments
Please contact Chris Wray for any assistance or comments giswebsite@gcro.ac.za.