|
2011 QoL Survey Viewer
|
|
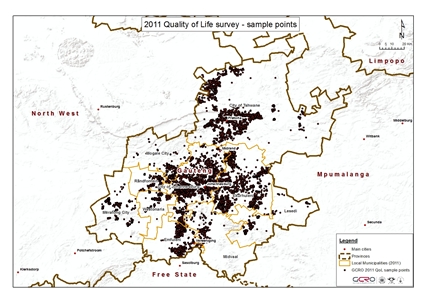
The second GCRO QoL survey was completed during 2011 with a total
sample of 16 729 interviews across the Gauteng province. The 2011 survey provides
an updated view of 2009 results, at both provincial and municipal-level, of a range
of measures such as service delivery, satisfaction with government, transport and
mobility, decent work, migration, respondents’ values and attitudes and a quality
of life index. Unlike the 2009 QoL survey, no wards outside of Gauteng were sampled.
The survey does however have a much larger sample with a much lower error bar.
A highly competitive tender was awarded to DataWorld in June 2011 to undertake the
fieldwork. In July, GCRO finalised the design of a revised questionnaire that balanced
time-series data from the 2009 QoL survey with new data informing the projects in
GCRO’s 3-year Strategic Framework. The 2011 local election wards were used as the
primary sampling units and the number of surveys required per ward calculated using
2010 adult population per ward estimates provided by the Lightstone 2010 DemprokeyX
data.
|
|
A total of 507 out of a possible 508 wards were surveyed in Gauteng – the exception
being a ward in Midvaal where access was impossible. A separate company was hired
to undertake back-checking to ensure quality, and the back-check teams were in field
throughout the fieldwork process. Two levels of weighting were applied to the surveys
using adult population, based on either ward level (15721 surveys) or municipal
level (1008 surveys). The final cleaned dataset has an error bar of 0.7%. For more
information, please access the 2011 Quality of Life
project page
|
To view, graph, download and print single variables (with the option
to cross tab by the old 2006 or new 2011 local municipal boundaries), click on the
single query button below or view the tutorial/help file.
|
Single
|
To view, graph, download and print single variables (no graphs
are available) cross tabbed by selecting from a limited list of demographic variables,
click on the multiple query button below or view the tutorial/help file.
|
Multiple
|
The data should be used for statistical and scientific research purposes only. Any books, articles,
conference papers, theses, dissertations, reports, or other publications that employ data obtained from
the GCRO QoL viewer must cite the source of data in accordance with the citation statement: Gauteng City-Region
Observatory (2011). GCRO 2011 Quality of Life Survey viewer.
GCRO and its partners bear no responsibility for use of the data or for interpretations
or inferences based upon such uses.
|
|
|
|