|
Welcome to the GCRO Quality of Life (QoL) survey viewer
|
|
In 2009, GCRO commissioned its first ‘Quality of Life’ survey,
in order to analyse the quality of life of citizens, identify key areas and groups
needing intervention and support, and provide an holistic assessment of life in
the Gauteng City-region – not just looking at Gross Domestic Product, or Value Add,
or similar economic measures, but including the values and attitudes of citizens,
their levels of social capital, alienation, anomie, and so on. The survey, because
of both the sample size and breadth, and quality of analysis, had a considerable
impact on government’s work, as well as enjoying significant media coverage. A second
QoL survey was completed in 2011, with a third survey - critical in that three
points in time will permit the GCRO to undertake trend analysis with a degree of
confidence - completed in 2013.
The GCRO QoL viewer has been developed to provide easy online access
to the survey data. Most of the variables are selectable, with an option to crosstab
by local municipal boundaries or a few other demographic variables. The results
are presented as tables and/or graphs and may be printed or downloaded. In all cases,
GCRO must be appropriately referenced, e.g. GCRO 2013 Quality of Life survey.
|
|
The SPSS data is also available on request from the GCRO for research/non-financial
gain purposes (info@gcro.ac.za).
|
|
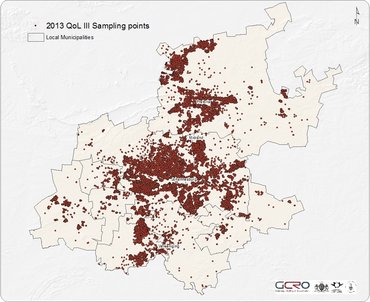
The 2013 GCRO QoL survey of 27490 respondents covers the entire
province of Gauteng with the 2011 local election wards utilised as the primary sampling
units. The error bar is 0.6%. For more information, please access the 2013 Quality of Life
project page or access the online interactive data by clicking the button (Access: 2013 QoL Survey Viewer) below.
|
Access: 2013 QoL Survey Viewer
|
|
The 2011 GCRO QoL survey of 16729 respondents covers the entire
province of Gauteng with the 2011 local election wards utilised as the primary sampling
units. The error bar is 0.7%. For more information, please access the 2011 Quality of Life
project page or access the online interactive data by clicking the button (Access: 2011 QoL Survey Viewer) below.
|
Access: 2011 QoL Survey Viewer
|
The 2009 GCRO QoL survey sample of 6636 respondents covered the
entire GCR, including the whole of Gauteng in detail, and selected GCR ‘footprints’
in four neighbouring provinces. For the first time, mappable, integrated data for
the GCR - with an error bar of 1,3%. More information (including a presentation
of the main results) is available on the 2009 Quality of Life
project page or access the online interactive data by clicking the button (Access: 2009 QoL Survey Viewer) below.
|
Access: 2009 QoL Survey Viewer
|
|