|
2009 QoL Survey Viewer
|
|
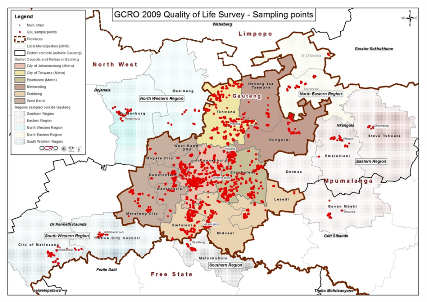
The first GCRO QoL survey was completed during 2009 with a total sample of 6636 interviews
across the Gauteng province and selected economic footprints in the neighbouring provinces
of North West, Free State and Mpumulanga. The survey measures a wide range of issues such
as levels of satisfaction with government services, poverty, socio-economic status, commuter
movement within the GCR and quality of life. In addition questions on the ‘headspace’ of
respondents enable values and attitudes to be mapped and analysed on top of socio-economic
variables. With a sample large enough to allow analysis both within and across municipalities,
for the first time a comparison across the entire GCR is possible, including the economic
footprints outside of Gauteng.
The fieldwork was completed by Data Research Africa (DRA) in August and September of 2009.
The 2009 version of local electoral wards used as the primary sampling unit, with 6636
respondents interviewed across 569 wards. The final dataset was delivered in December 2009
following an intensive verification process during November 2009 where fieldwork coordinate
capture issues were checked and corrected using GIS – a first for both GCRO and for the fieldwork
agency Data Research Africa (DRA). Weights were applied at a municipal level within Gauteng (using
Census 2001 population data per local/metropolitan municipality), and per total ward population for
the sampled regions outside Gauteng.
|
|
In these outlying regions, the sizes of the sampled wards in
municipalities such as Metsimaholo, Madibeng etc., do not reflect the whole municipalities, but only
those wards that were included in the study area were used for weighting purposes.
The final dataset has an error bar of 1.3%. More information (including a presentation of the main results)
is available on the 2009 Quality of Life
project page
|
To view, graph, download and print single variables (with the option
to cross tab by the old 2006 local municipal boundaries and regions in the neighbouring provinces), click on the
single query button below or view the tutorial/help file.
|
Single
|
To view, download or print variables (no graphs
are available) cross tabbed by selecting from a limited list of demographic variables,
click on the multiple query button below or view the tutorial/help file.
|
Multiple
|
The data should be used for statistical and scientific research purposes only. Any books, articles,
conference papers, theses, dissertations, reports, or other publications that employ data obtained from
the GCRO QoL viewer must cite the source of data in accordance with the citation statement: Gauteng City-Region
Observatory (2009). GCRO 2011 Quality of Life Survey viewer.
GCRO and its partners bear no responsibility for use of the data or for interpretations
or inferences based upon such uses.
|
|
|